Realignment- and Expression-based Multispecies deconvolution for Single cell (REMS) pipeline tutorial
Realignment- and Expression-based Multispecies deconvolution for Single cell (REMS)
REMS is a pipeline which removes misalignment error and ambient RNA signals when dealing with mixed species single cell data (xenograft or co-cultured cell). This pipeline can be applied to all species and is not confined to human/mouse cell mix.
For further information about this pipeline, check our bioarchive preprint.
“Expression-based species deconvolution and realignment removes misalignment error in multispecies single-cell data.”
or contact at
mesnger12 (at) gmai1 (dot) C0M
Install
Download the attachment file at the end of this page.
You can make the environment for REMS with conda.
Flowchart
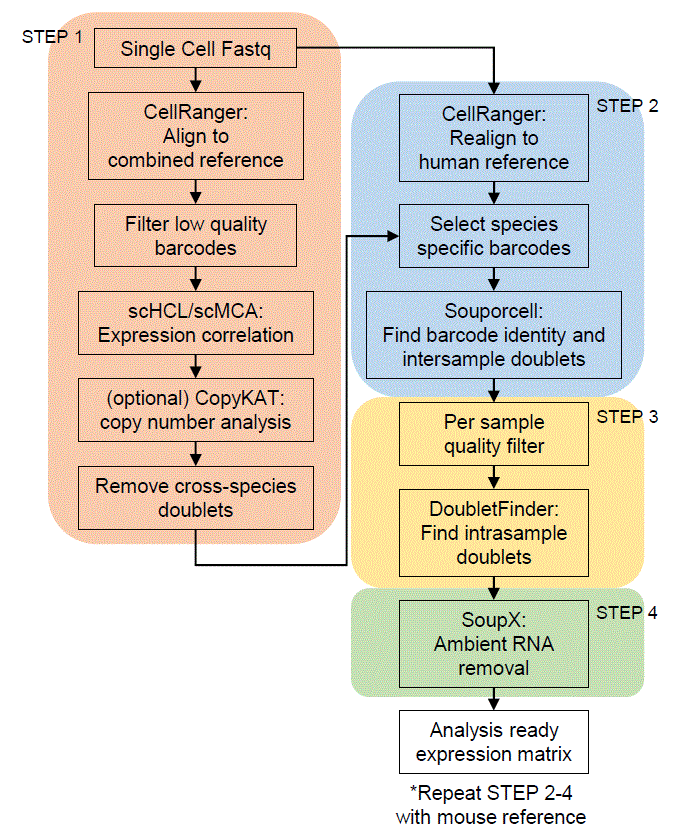
Tutorial
Step1 : Align to combined reference
Start with single cell data aligned to human and mouse combined reference. Count matrix data used in tutorial can be found at below(attachment). For analysis speed and simplicity, we provide a downsampled data used in our manuscript.
First, we calculate mitochondrial gene percentage in ambient RNA from unfiltered matrix. If you are using your own data, unfiltered matrix data can be found at outs/raw_feature_bc_matrix for CellRanger. After we load the count data, we select barcodes with less than 100 UMI counts for ambient RNA expression.
Then, we calculate the mitochondrial gene percentage for each species separately. You may need to change the gene name depending on the combined reference you used.
We load filtered count matrix and filter out barcodes with low expressed gene count (nFeature in Seurat) and high mitochondrial gene percentage. As Seurat does not distinguish human and mouse references, we also calculate the nCount and nFeature value for each reference. The tutorial selects barcodes from rawdata instead of loading count from the filtered data.
In this tutorial, we used the max value of 20 or twice the mitochondrial percentage in ambient RNA. You may change the value depending on the data. Cancer cells typically have higher mitochondrial percentage.
The data is cleaned-up for analysis. To detect cross-species doublet (droplets containing both human and mouse cells), we use correlation value from scHCL/scMCA. This takes a long time, as each cell is compared to all cell type in the database.
Then we apply and remove cross-species doublets.
You can plot the correlation result with.
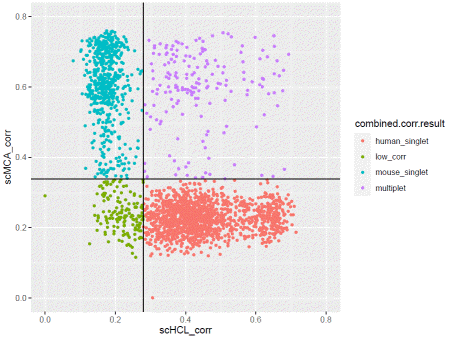
If you are satisfied with the result, apply the filter.
(optional step)
When tumor cell, or cells with high aneuploidy is pooled together, we can additionally use CNV information to identify cross-species doublets. Note that copykat may give reverse result, depending on the normal cluster it selects, so we recommend checking the expression for each copykat result. In this tutorial, we will skip the CNV analysis.
Human and mouse only data can be generated as following.
Step2: realign to species matching reference
Then we realign the data to each species specific reference. In practice, we aligned all data to human reference and selected barcodes which contains human cell. If the library contains multiple human identities, use deconvolution methods which can selectively process droplets containing human cell. We found that mouse cells generated noise to deconvolution methods, and do not recommend using all droplets in decovolution step. If your data does not contain multiple identities, ignore deconvolution steps.
Note that some cells may not be called as cell containing droplets when re-aligned to human reference. We remove barcodes with low confidence in deconvolution data, as well as barcodes not called in human reference results.
Do not filter doublets here, as we may can true intersample doublets to find intrasample doublets further downstream.
Step3: Per sample quality filter
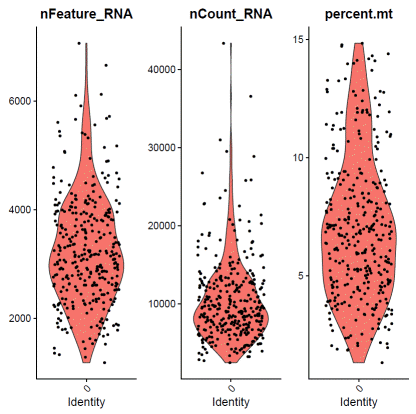
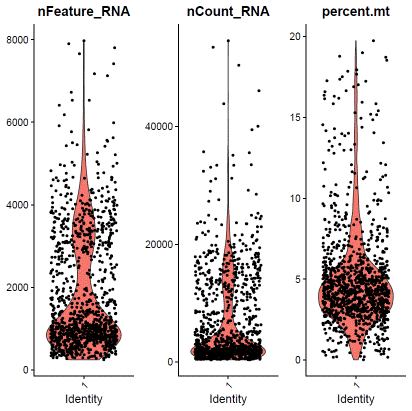
We select singlets of each identity, and perform quality filter separately, as each sample may differ in each quality metrics due to tissue, sample type, etc. Normally, you would set mitochondrial gene percentage, UMI count, gene count depending on the data distribution. In this tutorial, we simply used the same criteria used in our manuscript.
We then perform expression based doublet identification. In this tutorial, we used DoubletFinder.
When you are satisfied with doublet calling results, apply filter.
Save the doublet filtered cluster information for the next step.
Repeat step2 & 3 for mouse data. We recommend using ambient RNA contamination percentage of both species data for the next step. Mouse data used in this tutorial is not pooled, so we skip deconvolution process.
Step4: Ambient RNA removal
We apply SoupX to remove ambient human as well as ambient mouse reads from both human and mouse data. During AutoEstCont, you may need to lower the tfidMin, soupQuantile value if the data you are using is highly homogeneous.
REMS is a pipeline which removes misalignment error and ambient RNA signals when dealing with mixed species single cell data (xenograft or co-cultured cell). This pipeline can be applied to all species and is not confined to human/mouse cell mix.
For further information about this pipeline, check our bioarchive preprint.
“Expression-based species deconvolution and realignment removes misalignment error in multispecies single-cell data.”
or contact at
mesnger12 (at) gmai1 (dot) C0M
Install
Download the attachment file at the end of this page.
You can make the environment for REMS with conda.
conda env create --file REMS.yml
conda activate REMS
Then open R and install each package listed in install.R, or simply select CRAN mirror and copy paste the install script.Flowchart

Tutorial
Step1 : Align to combined reference
Start with single cell data aligned to human and mouse combined reference. Count matrix data used in tutorial can be found at below(attachment). For analysis speed and simplicity, we provide a downsampled data used in our manuscript.
### load library### for installation of each tool, please follow the guide for each tools.library(dplyr)
library(ggplot2)
library(stringr)
library(Matrix)
library(DoubletFinder)
library(DropletUtils)
library(Seurat)
library(scHCL)
library(scMCA)
library(copykat)
library(SoupX)First, we calculate mitochondrial gene percentage in ambient RNA from unfiltered matrix. If you are using your own data, unfiltered matrix data can be found at outs/raw_feature_bc_matrix for CellRanger. After we load the count data, we select barcodes with less than 100 UMI counts for ambient RNA expression.
### prepare unfiltered matrixraw.combined.count=Read10X(data.dir="/path_to_combined_reference_output/outs/raw_feature_bc_matrix")rawdata=CreateSeuratObject(counts=raw.combined.count, project="combined")ambientdata=subset(rawdata,nCount_RNA<100)Then, we calculate the mitochondrial gene percentage for each species separately. You may need to change the gene name depending on the combined reference you used.
### human ambient mt percentageambient.human=sum(ambientdata@assays$RNA@counts[grep("^GRCh38-",rownames(ambientdata@assays$RNA@counts)),])ambient.human.mt=sum(ambientdata@assays$RNA@counts[grep("^GRCh38-MT-",rownames(ambientdata@assays$RNA@counts)),])ambient.human.mt.percent=ambient.human.mt/ambient.human*100### mouse ambient mt percentageambient.mouse=sum(ambientdata@assays$RNA@counts[grep("^mm10---",rownames(ambientdata@assays$RNA@counts)),])ambient.mouse.mt=sum(ambientdata@assays$RNA@counts[grep("^mm10---mt-",rownames(ambientdata@assays$RNA@counts)),])ambient.mouse.mt.percent=ambient.mouse.mt/ambient.mouse*100We load filtered count matrix and filter out barcodes with low expressed gene count (nFeature in Seurat) and high mitochondrial gene percentage. As Seurat does not distinguish human and mouse references, we also calculate the nCount and nFeature value for each reference. The tutorial selects barcodes from rawdata instead of loading count from the filtered data.
### prepare combined reference data### when using your own data
#combined.count=Read10X(data.dir="/path_to_combined_reference_output/outs/filtered_feature_bc_matrix")#cdata=CreateSeuratObject(counts=combined.count, project=”combined”,min.features=200)
### when using tutorial data
combined.cell.barcode=read.table("/path_to_data/combined.cell.barcode.tsv")
cdata=subset(rawdata,cells=combined.cell.barcode$V1)

### nCount, nFeature summarycdata@meta.data$combined.human_nCount=colSums(cdata@assays$RNA@counts[grep("^GRCh38-",rownames(cdata@assays$RNA@counts)),])cdata@meta.data$combined.mouse_nCount=colSums(cdata@assays$RNA@counts[grep("^mm10---",rownames(cdata@assays$RNA@counts)),])cdata@meta.data$combined.major.species=ifelse(cdata@meta.data$combined.human_nCount>cdata@meta.data$combined.mouse_nCount, ifelse(cdata@meta.data$combined.human_nCount==cdata@meta.data$combined.mouse_nCount,"both","human"),"mouse")cdata@meta.data$combined.human_nFeature=colSums(as.matrix(cdata@assays$RNA@counts[grep("^GRCh38-",rownames(cdata@assays$RNA@counts)),]>0))cdata@meta.data$combined.mouse_nFeature=colSums(as.matrix(cdata@assays$RNA@counts[grep("^mm10---",rownames(cdata@assays$RNA@counts)),]>0))In this tutorial, we used the max value of 20 or twice the mitochondrial percentage in ambient RNA. You may change the value depending on the data. Cancer cells typically have higher mitochondrial percentage.
### filter by mitochondrial percentcdata@meta.data$combined.human.mt.percent=colSums(cdata@assays$RNA@counts[grep("^GRCh38-MT-",rownames(cdata@assays$RNA@counts)),])/cdata@meta.data$combined.human_nCount*100cdata@meta.data$combined.mouse.mt.percent=colSums(cdata@assays$RNA@counts[grep("^mm10---mt-",rownames(cdata@assays$RNA@counts)),])/cdata@meta.data$combined.mouse_nCount *100cdata@meta.data$combined.mt.filter=ifelse(cdata@meta.data$combined.human_nCount>=100&cdata@meta.data$combined.human.mt.percent>=max(20,ambient.human.mt.percent*2),"high_mt_human","pass")cdata@meta.data$combined.mt.filter=ifelse(cdata@meta.data$combined.mouse_nCount>=100&cdata@meta.data$combined.mouse.mt.percent>=max(20,ambient.mouse.mt.percent*2),"high_mt_mouse",cdata@meta.data$combined.mt.filter)cdata=subset(cdata,combined.mt.filter=="pass"&combined.major.species!="both")The data is cleaned-up for analysis. To detect cross-species doublet (droplets containing both human and mouse cells), we use correlation value from scHCL/scMCA. This takes a long time, as each cell is compared to all cell type in the database.
### scHCLcombined.human.count=cdata@assays$RNA@counts[grep("^GRCh38-",rownames(cdata@assays$RNA@counts)),]rownames(combined.human.count)=str_remove(rownames(combined.human.count),"^GRCh38-")scHCL = scHCL(scdata = combined.human.count, numbers_plot=1)hclmeta=scHCL$scHCL_probility[,c(2,3)]rownames(hclmeta)=scHCL$scHCL_probility$Cellcolnames(hclmeta)=c("scHCL_cell","scHCL_corr")cdata = AddMetaData(cdata, hclmeta)cdata@meta.data$scHCL_corr[is.na(cdata@meta.data$scHCL_corr)] = 0### scMCAcombined.mouse.count=cdata@assays$RNA@counts[grep("^mm10---",rownames(cdata@assays$RNA@counts)),]rownames(combined.mouse.count)=str_remove(rownames(combined.mouse.count),"^mm10---")scMCA = scMCA(scdata = combined.mouse.count, numbers_plot=1)mcameta=scMCA$scMCA_probility[,c(2,3)]rownames(mcameta)=scMCA$scMCA_probility$Cellcolnames(mcameta)=c("scMCA_cell","scMCA_corr")cdata = AddMetaData(cdata, mcameta)cdata@meta.data$scMCA_corr[is.na(cdata@meta.data$scMCA_corr)] = 0Then we apply and remove cross-species doublets.
### filter by correlationcutoff=2.58human.median=median(cdata@meta.data$scHCL_corr[cdata@meta.data$combined.major.species=="mouse"])human.mad=mad(cdata@meta.data$scHCL_corr[cdata@meta.data$combined.major.species=="mouse"])mouse.median=median(cdata@meta.data$scMCA_corr[cdata@meta.data$combined.major.species=="human"])mouse.mad=mad(cdata@meta.data$scMCA_corr[cdata@meta.data$combined.major.species=="human"])cdata@meta.data$combined.corr.result=ifelse(cdata@meta.data$scHCL_corr>=human.median+cutoff*human.mad&cdata@meta.data$scMCA_corr>=mouse.median+cutoff*mouse.mad,"multiplet","low_corr")cdata@meta.data$combined.corr.result=ifelse(cdata@meta.data$scHCL_corr<human.median+cutoff*human.mad&cdata@meta.data$scMCA_corr>=mouse.median+cutoff*mouse.mad,"mouse_singlet",cdata@meta.data$combined.corr.result)cdata@meta.data$combined.corr.result=ifelse(cdata@meta.data$scHCL_corr>=human.median+cutoff*human.mad&cdata@meta.data$scMCA_corr<mouse.median+cutoff*mouse.mad,"human_singlet",cdata@meta.data$combined.corr.result)
### generate filtercdata@meta.data$corr.filter=ifelse(cdata@meta.data$combined.corr.result=="multiplet","filter","pass")cdata@meta.data$corr.filter=ifelse(cdata@meta.data$combined.major.species=="human"&cdata@meta.data$combined.corr.result=="mouse_singlet","filter",cdata@meta.data$corr.filter)cdata@meta.data$corr.filter=ifelse(cdata@meta.data$combined.major.species=="mouse"&cdata@meta.data$combined.corr.result=="human_singlet","filter",cdata@meta.data$corr.filter)You can plot the correlation result with.
ggplot(cdata@meta.data,aes(x=scHCL_corr,y=scMCA_corr,color=combined.corr.result))+geom_point(size=1)+xlim(0,0.8)+ylim(0,0.8)+geom_vline(xintercept=human.median+cutoff*human.mad)+geom_hline(yintercept=mouse.median+cutoff*mouse.mad)+coord_fixed()
If you are satisfied with the result, apply the filter.
cdata=subset(cdata,corr.filter!="filter")(optional step)
When tumor cell, or cells with high aneuploidy is pooled together, we can additionally use CNV information to identify cross-species doublets. Note that copykat may give reverse result, depending on the normal cluster it selects, so we recommend checking the expression for each copykat result. In this tutorial, we will skip the CNV analysis.
### copykat for CNV analysis#human.copykat=copykat(rawmat=human.count,id.type="S",ngene.chr=5,sam.name="combined.human",distance="euclidean")#copykat=read.table("/path_to_copykat_output/combined.human_copykat_prediction.txt"),header=T,row.names="cell.names",sep="\t")#cdata=AddMetaData(cdata,copykat)#levels(cdata@meta.data$copykat.pred)=c(levels(cdata@meta.data$copykat.pred),"filtered")#cdata@meta.data$copykat.pred[is.na(cdata@meta.data$copykat.pred)]<-"filtered"#cdata@meta.data$cnv.filter=ifelse(cdata@meta.data$combined.major.species=="mouse"&cdata@meta.data$copykat.pred%in%c("aneuploid","diploid"),"filter","pass")#cdata@meta.data$cnv.filter=ifelse(cdata@meta.data$combined.major.species=="human"&cdata@meta.data$copykat.pred%in%c("filtered"),"filter", cdata@meta.data$cnv.filter)#cdata=subset(cdata,cnv.filter!="filter")Human and mouse only data can be generated as following.
combined.hdata=subset(cdata,combined.major.species=="human")combined.mdata=subset(cdata,combined.major.species=="mouse")Step2: realign to species matching reference
Then we realign the data to each species specific reference. In practice, we aligned all data to human reference and selected barcodes which contains human cell. If the library contains multiple human identities, use deconvolution methods which can selectively process droplets containing human cell. We found that mouse cells generated noise to deconvolution methods, and do not recommend using all droplets in decovolution step. If your data does not contain multiple identities, ignore deconvolution steps.
### preparing your own human reference data#human.count=Read10X(data.dir="/path_to_human_reference_output/outs/filtered_feature_bc_matrix")#human.count=human.count[,colnames(human.count)%in%rownames(combined.hdata@meta.data)]#human.deconvolution.data=read.table("/path_to_deconvolution_file/human.deconvolution.tsv",sep="\t",header=T,row.names="barcode")#hdata=CreateSeuratObject(counts=human.count,project="human",min.features=200,meta=human.deconvolution.data)### preparing tutorial dataraw.human.count=Read10X(data.dir="/path_to_human_reference_output/outs/raw_feature_bc_matrix")human.count=raw.human.count[,colnames(raw.human.count)%in%rownames(combined.hdata@meta.data)]human.deconvolution.data=read.table("/path_to_deconvolution_file/human.deconvolution.tsv",sep="\t",header=T,row.names="barcode")hdata=CreateSeuratObject(counts=human.count,project="human",min.features=200,meta=human.deconvolution.data)
Note that some cells may not be called as cell containing droplets when re-aligned to human reference. We remove barcodes with low confidence in deconvolution data, as well as barcodes not called in human reference results.
hdata=subset(hdata,status!="unassigned" & status!="NA")
hdata=PercentageFeatureSet(hdata,pattern="^MT-",col.name="percent.mt")hdata=SetIdent(hdata,value=hdata@meta.data$assignment)hdata@meta.data$filter=ifelse(hdata@meta.data$status=="doublet","Doublet","Singlet")Do not filter doublets here, as we may can true intersample doublets to find intrasample doublets further downstream.
Step3: Per sample quality filter
We select singlets of each identity, and perform quality filter separately, as each sample may differ in each quality metrics due to tissue, sample type, etc. Normally, you would set mitochondrial gene percentage, UMI count, gene count depending on the data distribution. In this tutorial, we simply used the same criteria used in our manuscript.
###repeat for each identity### hGO03
identity="0"f0data=subset(hdata,assignment==identity&status=="singlet")VlnPlot(f0data,features=c("nFeature_RNA","nCount_RNA","percent.mt"),ncol=3)

### select QC-failed cells
f0data.QCfail=subset(f0data,subset=percent.mt>=15|nCount_RNA<2000|nFeature_RNA<1000)hdata@meta.data$filter=ifelse(rownames(hdata@meta.data)%in%rownames(f0data.QCfail@meta.data),"QCfail",hdata@meta.data$filter)### hLT02identity="1"f1data=subset(hdata,assignment==identity&status=="singlet")VlnPlot(f1data,features=c("nFeature_RNA","nCount_RNA","percent.mt"),ncol=3)

### select QC-failed cellsf1data.QCfail=subset(f1data,subset=percent.mt>=10|nCount_RNA<1000|nFeature_RNA<500)hdata@meta.data$filter=ifelse(rownames(hdata@meta.data)%in%rownames(f1data.QCfail@meta.data),"QCfail",hdata@meta.data$filter)### apply filterhdata=subset(hdata,filter!="QCfail")We then perform expression based doublet identification. In this tutorial, we used DoubletFinder.
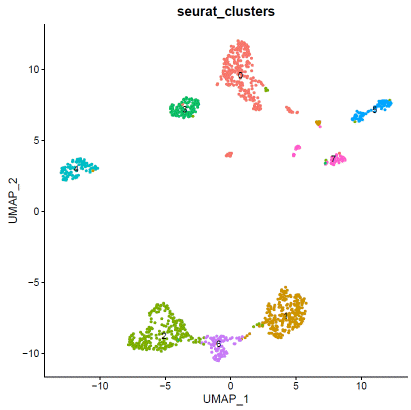
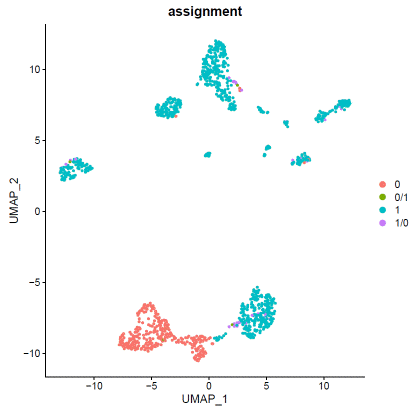
### expression normalizationhdata=SCTransform(hdata,vars.to.regress=c("percent.mt"))hdata=RunPCA(hdata)hdata=FindNeighbors(hdata,dims=1:20)hdata=FindClusters(hdata,resolution=0.1,algorithm="louvain")hdata=RunUMAP(hdata,dims=1:20)### basic visualizationDimPlot(hdata,reduction='umap',group.by="seurat_clusters",label=T)+NoLegend()DimPlot(hdata,reduction='umap',group.by="assignment",label=F)


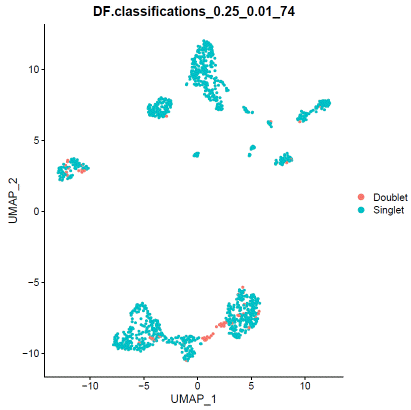
### doubletfindersweep.res.list=paramSweep_v3(hdata,PCs=1:20,sct=TRUE)gt.calls=hdata@meta.data[rownames(sweep.res.list[[1]]),which(colnames(hdata@meta.data)=="filter")]sweep.stats=summarizeSweep(sweep.res.list,GT=TRUE,GT.calls=gt.calls)bcmvn=find.pK(sweep.stats)pK=as.numeric(as.character(bcmvn$pK))BCmetric=bcmvn$BCmetricpK_choose=pK[which(BCmetric%in%max(BCmetric))]### adjust value to your dataloadedcell=25000pooled=2nonidentifiedmultiplet=loadedcell*0.000004597701/pooledhomotypic.prop=modelHomotypic(hdata@meta.data$seurat_clusters)nExp_poi=round(nonidentifiedmultiplet*length(hdata@meta.data$seurat_clusters))hdata=doubletFinder_v3(hdata,PCs=1:20,pN=0.25,pK=pK_choose,nExp=nExp_poi,reuse.pANN=FALSE,sct=TRUE)### visualize doubletfinder resultDimPlot(hdata,reduction='umap',group.by=paste0("DF.classifications_0.25_",pK_choose,"_",nExp_poi),label=FALSE)
When you are satisfied with doublet calling results, apply filter.
### remove doubletfinder identified doubletsDF.result=FetchData(hdata,paste0("DF.classifications_0.25_",pK_choose,"_",nExp_poi))hdata=hdata[,which(DF.result=="Singlet")]### remove souporcell identified doubletshdata=subset(hdata,filter!="Doublet")Save the doublet filtered cluster information for the next step.
write.table(data.frame("##"=rownames(hdata@meta.data),hdata@meta.data),"/path_to_output/human.cluster.tsv",quote=F,sep='\t',row.names=F)write10xCounts(hdata@assays$RNA@counts,path="path_to_human_output/doublet_filtered_matrix",type="sparse",overwrite=T,version="3")Repeat step2 & 3 for mouse data. We recommend using ambient RNA contamination percentage of both species data for the next step. Mouse data used in this tutorial is not pooled, so we skip deconvolution process.
### preparing your own mouse reference data#mouse.count=Read10X(data.dir="/path_to_mouse_reference_output/outs/filtered_feature_bc_matrix")#mouse.count=mouse.count[,colnames(mouse.count)%in%rownames(combined.mdata@meta.data)]#mouse.deconvolution.data=read.table("/path_to_deconvolution_file/mouse.deconvolution.tsv",sep="\t",header=T,row.names="barcode")#mdata=CreateSeuratObject(counts=mouse.count,project="mouse",min.features=200,meta=mouse.deconvolution.data)### preparing tutorial dataraw.mouse.count=Read10X(data.dir="/path_to_mouse_reference_output/outs/raw_feature_bc_matrix")mouse.count=raw.mouse.count[,colnames(raw.mouse.count)%in%rownames(combined.mdata@meta.data)]mdata=CreateSeuratObject(counts=mouse.count,project="mouse",min.features=200)
### mIO03 sample filter
mdata=PercentageFeatureSet(mdata,pattern="^mt-",col.name="percent.mt")
mdata@meta.data$filter="PASS"
VlnPlot(mdata,features=c("nFeature_RNA","nCount_RNA","percent.mt"),ncol=3)
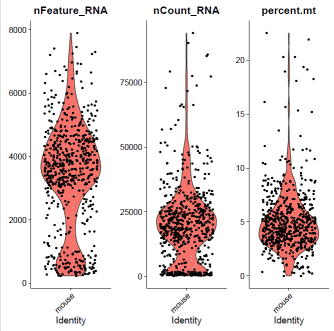
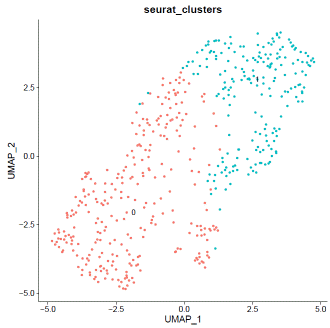
### select QC-failed cellsmdata.QCfail=subset(mdata,subset=percent.mt>=10|nCount_RNA<2000|nFeature_RNA<1000)mdata@meta.data$filter=ifelse(rownames(mdata@meta.data)%in%rownames(mdata.QCfail@meta.data),"QCfail",mdata@meta.data$filter)### apply filtermdata=subset(mdata,filter!="QCfail")### expression normalizationmdata=SCTransform(mdata,vars.to.regress=c("percent.mt"))mdata=RunPCA(mdata)mdata=FindNeighbors(mdata,dims=1:20)mdata=FindClusters(mdata,resolution=0.1,algorithm="louvain")mdata=RunUMAP(mdata,dims=1:20)### basic visualizationDimPlot(mdata,reduction='umap',group.by="seurat_clusters",label=T)+NoLegend()
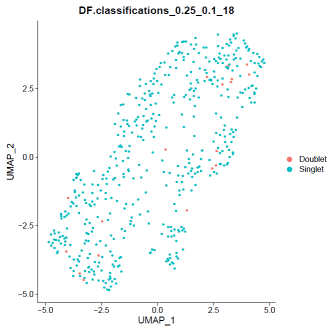
### doubletfindermouse.sweep.res.list=paramSweep_v3(mdata,PCs=1:20,sct=TRUE)mouse.sweep.stats=summarizeSweep(mouse.sweep.res.list,GT=F)mouse.bcmvn=find.pK(mouse.sweep.stats)mouse.pK=as.numeric(as.character(mouse.bcmvn$pK))mouse.BCmetric=mouse.bcmvn$BCmetricmouse.pK_choose=pK[which(mouse.BCmetric%in%max(mouse.BCmetric))]### adjust value to your datamouse.loadedcell=8000mouse.pooled=1mouse.nonidentifiedmultiplet=mouse.loadedcell*0.000004597701/mouse.pooledmouse.homotypic.prop=modelHomotypic(mdata@meta.data$seurat_clusters)mouse.nExp_poi=round(mouse.nonidentifiedmultiplet*length(mdata@meta.data$seurat_clusters))mdata=doubletFinder_v3(mdata,PCs=1:20,pN=0.25,pK=mouse.pK_choose,nExp=mouse.nExp_poi,reuse.pANN=FALSE,sct=TRUE)### visualize doubletfinder resultDimPlot(mdata,reduction='umap',group.by=paste0("DF.classifications_0.25_",mouse.pK_choose,"_",mouse.nExp_poi),label=FALSE)
### remove doubletfinder identified doubletsmouse.DF.result=FetchData(mdata,paste0("DF.classifications_0.25_",mouse.pK_choose,"_",mouse.nExp_poi))mdata=mdata[,which(mouse.DF.result=="Singlet")]### save mouse informationwrite.table(data.frame("##"=rownames(mdata@meta.data),mdata@meta.data),"/path_to_output/mouse.cluster.tsv",quote=F,sep='\t',row.names=F)write10xCounts(mdata@assays$RNA@counts,path="path_to_mouse_output/doublet_filtered_matrix",type="sparse",overwrite=T,version="3")Step4: Ambient RNA removal
We apply SoupX to remove ambient human as well as ambient mouse reads from both human and mouse data. During AutoEstCont, you may need to lower the tfidMin, soupQuantile value if the data you are using is highly homogeneous.
### prepare human dataraw.human.count=Read10X(data.dir="/path_to_human_reference_output/outs/raw_feature_bc_matrix")human.cluster=read.table("/path_to_human_output/human.cluster.tsv",header=T,row.names="X..")cell.human.count=raw.human.count[,colnames(raw.human.count)%in%rownames(human.cluster)]human.soupdata=SoupChannel(raw.human.count,cell.human.count)human.soupdata=setClusters(human.soupdata,human.cluster$seurat_clusters)human.soupdata=autoEstCont(human.soupdata,tfidfMin=1.0,soupQuantile=0.9)### prepare mouse dataraw.mouse.count=Read10X(data.dir="/path_to_mouse_reference_output/outs/raw_feature_bc_matrix")mouse.cluster=read.table("/path_to_mouse_output/mouse.cluster.tsv",header=T,row.names="X..")cell.mouse.count=raw.mouse.count[,colnames(raw.mouse.count)%in%rownames(mouse.cluster)]mouse.soupdata=SoupChannel(raw.mouse.count,cell.mouse.count)mouse.soupdata=setClusters(mouse.soupdata,mouse.cluster$seurat_clusters)mouse.soupdata=autoEstCont(mouse.soupdata,tfidfMin=0.5,soupQuantile=0.8)### add contamination fractioncombined.contamination=human.soupdata$metaData$rho[1]+mouse.soupdata$metaData$rho[1]additional.fraction=0.05### final count matrixhuman.soupdata$metaData$rho=combined.contamination+additional.fractionhuman.finalcount=adjustCounts(human.soupdata,roundToInt=T)writeMM(human.finalcount,file="path_to_human_output/doublet_filtered_matrix/matrix.mtx")mouse.soupdata$metaData$rho=combined.contamination+additional.fractionmouse.finalcount=adjustCounts(mouse.soupdata,roundToInt=T)writeMM(mouse.finalcount,file="path_to_mouse_output/doublet_filtered_matrix/matrix.mtx")
Substitute the matrix.mtx.gz in path_to_output/doublet_filtered_matrix with newly generated matrix.mtx and gzip it to create the final data matrix.
> sessionInfo()R version 4.0.5 (2021-03-31)Platform: x86_64-conda-linux-gnu (64-bit)Running under: CentOS Linux 7 (Core)Matrix products: defaultBLAS/LAPACK: /data/Tools/anaconda3/envs/REMS/lib/libopenblasp-r0.3.15.solocale:[1] LC_CTYPE=en_US.UTF-8 LC_NUMERIC=C [3] LC_TIME=en_US.UTF-8 LC_COLLATE=en_US.UTF-8 [5] LC_MONETARY=en_US.UTF-8 LC_MESSAGES=en_US.UTF-8 [7] LC_PAPER=en_US.UTF-8 LC_NAME=C [9] LC_ADDRESS=C LC_TELEPHONE=C [11] LC_MEASUREMENT=en_US.UTF-8 LC_IDENTIFICATION=C attached base packages:[1] parallel stats4 grid stats graphics grDevices utils [8] datasets methods base other attached packages:[1] DropletUtils_1.10.3 SingleCellExperiment_1.12.0[3] SummarizedExperiment_1.20.0 Biobase_2.50.0 [5] GenomicRanges_1.42.0 GenomeInfoDb_1.26.7 [7] IRanges_2.24.1 S4Vectors_0.28.1 [9] BiocGenerics_0.36.1 MatrixGenerics_1.2.1 [11] matrixStats_0.58.0 ROCR_1.0-11 [13] KernSmooth_2.23-20 sctransform_0.3.2 [15] fields_12.3 viridis_0.6.1 [17] viridisLite_0.4.0 spam_2.6-0 [19] dotCall64_1.0-1 SoupX_1.5.2 [21] copykat_1.0.4 scMCA_0.2.0 [23] scHCL_0.1.1 SeuratObject_4.0.1 [25] Seurat_4.0.2 DoubletFinder_2.0.3 [27] Matrix_1.3-3 stringr_1.4.0 [29] ggplot2_3.3.3 dplyr_1.0.6 loaded via a namespace (and not attached):[1] plyr_1.8.6 igraph_1.2.6 [3] lazyeval_0.2.2 splines_4.0.5 [5] BiocParallel_1.24.1 listenv_0.8.0 [7] scattermore_0.7 digest_0.6.27 [9] htmltools_0.5.1.1 fansi_0.5.0 [11] magrittr_2.0.1 tensor_1.5 [13] cluster_2.1.2 limma_3.46.0 [15] globals_0.14.0 R.utils_2.10.1 [17] spatstat.sparse_2.0-0 colorspace_2.0-1 [19] ggrepel_0.9.1 crayon_1.4.1 [21] RCurl_1.98-1.3 jsonlite_1.7.2 [23] spatstat.data_2.1-0 survival_3.2-11 [25] zoo_1.8-9 glue_1.4.2 [27] polyclip_1.10-0 gtable_0.3.0 [29] zlibbioc_1.36.0 XVector_0.30.0 [31] leiden_0.3.8 DelayedArray_0.16.3 [33] Rhdf5lib_1.12.1 future.apply_1.7.0 [35] maps_3.3.0 HDF5Array_1.18.1 [37] abind_1.4-5 scales_1.1.1 [39] pheatmap_1.0.12 edgeR_3.32.1 [41] DBI_1.1.1 miniUI_0.1.1.1 [43] Rcpp_1.0.6 xtable_1.8-4 [45] dqrng_0.3.0 reticulate_1.20 [47] spatstat.core_2.1-2 DT_0.18 [49] htmlwidgets_1.5.3 httr_1.4.2 [51] RColorBrewer_1.1-2 ellipsis_0.3.2 [53] ica_1.0-2 scuttle_1.0.4 [55] R.methodsS3_1.8.1 pkgconfig_2.0.3 [57] farver_2.1.0 uwot_0.1.10 [59] deldir_0.2-10 locfit_1.5-9.4 [61] utf8_1.2.1 tidyselect_1.1.1 [63] labeling_0.4.2 rlang_0.4.11 [65] reshape2_1.4.4 later_1.2.0 [67] munsell_0.5.0 tools_4.0.5 [69] generics_0.1.0 ggridges_0.5.3 [71] fastmap_1.1.0 goftest_1.2-2 [73] fitdistrplus_1.1-3 purrr_0.3.4 [75] RANN_2.6.1 sparseMatrixStats_1.2.1 [77] pbapply_1.4-3 future_1.21.0 [79] nlme_3.1-152 mime_0.10 [81] R.oo_1.24.0 compiler_4.0.5 [83] shinythemes_1.2.0 rstudioapi_0.13 [85] plotly_4.9.3 png_0.1-7 [87] spatstat.utils_2.1-0 tibble_3.1.2 [89] stringi_1.6.2 RSpectra_0.16-0 [91] lattice_0.20-44 vctrs_0.3.8 [93] pillar_1.6.1 lifecycle_1.0.0 [95] rhdf5filters_1.2.1 BiocManager_1.30.15 [97] spatstat.geom_2.1-0 lmtest_0.9-38 [99] RcppAnnoy_0.0.18 data.table_1.14.0 [101] cowplot_1.1.1 bitops_1.0-7 [103] irlba_2.3.3 httpuv_1.6.1 [105] patchwork_1.1.1 R6_2.5.0 [107] promises_1.2.0.1 gridExtra_2.3 [109] parallelly_1.25.0 codetools_0.2-18 [111] MASS_7.3-54 assertthat_0.2.1 [113] rhdf5_2.34.0 withr_2.4.2 [115] GenomeInfoDbData_1.2.4 mgcv_1.8-35 [117] beachmat_2.6.4 rpart_4.1-15 [119] tidyr_1.1.3 DelayedMatrixStats_1.12.3[121] Rtsne_0.15 shiny_1.6.0
Files (1)
- REMS.tutorial.files.tar.gz (55 MB, download:469)

